EpiQC Software Overview – The Programs Update
A large proportion of a Field QC’s time is spent looking for errors and anomalies in the Mbytes of data which are produced each day on a typical seismic crew. EpiQC software aims to reduce this time while at the same time increasing QC resolution and hence confidence in the data integrity on land seismic projects.
The Data
All of the seismic crew’s data will be delivered to the Client Field QC as files of varying format depending on the data origin. Daily Reports as Excel files; Equipment test data as binary or text files; Recorder daily files in recording instrument format; Survey files in text or SPS format; Seismic data in SEGY or SEGD format. The Field QC must be able to read and analyse all of the various files and formats.
Typical QC method
Typically the Field QC will manually convert a file’s data into an Excel spreadsheet using the tools available in Excel which allows data files to be split up into their various elements. Once this is done the data is then usually cut and pasted into another spreadsheet created specifically for a particular project. Spreadsheet tables and charts are then manually adjusted to match the data for that day. This process can take some time depending on the complexity of the data.
EpiQC QC method
All EpiQC programs have an “Open File” button which allows the Field QC to select the file to be analysed. The EpiQC software loads the file into memory, performs all necessary reformatting and then creates a spreadsheet perfectly matched to the data for that particular day. Typically the software can process tens of thousands of lines of data and then produce a spreadsheet in just a few seconds. Different crew systems and formats are catered for by a settings table which is set up in a few minutes at the start of each new project.
“Two Click QC”
Crew data which requires only a single file can be checked in just two mouse clicks. Press the Open File button (click), select the file (click). EpiQC then automatically carries out all reformatting, processing and analysis required to produce the final charts, tables and reports that clearly identify errors and anomalies in the data.
The EpiQC user interface
The following image shows the user interface for the SMT Analyser program.
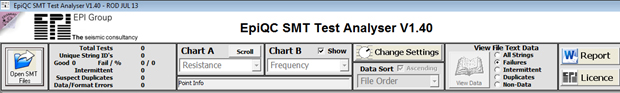
All EpiQC programs have a similar look and in almost all cases opening a file for analysis is the only user interaction required to start the reformatting, processing, analysis and display. Some programs will also need a reference file but this too is simply selected by the user with no further interaction required.
Setting up for different projects
Ad hoc spreadsheets created on the fly at the start of a project or copy/pasted from previous projects often require a large amount of modification in order to meet the requirements of the current project. These modifications will invariably involve altering spreadsheet cell formulae, which is time consuming and error prone.
EpiQC programs have been designed by identifying the aspects of the data that tend to change from project to project and then provide a table of settings which allow these differences to be accommodated. The following image shows the settings for the Sensor Log Analyser program. All EpiQC settings forms have a similar look and all allow settings to be saved.
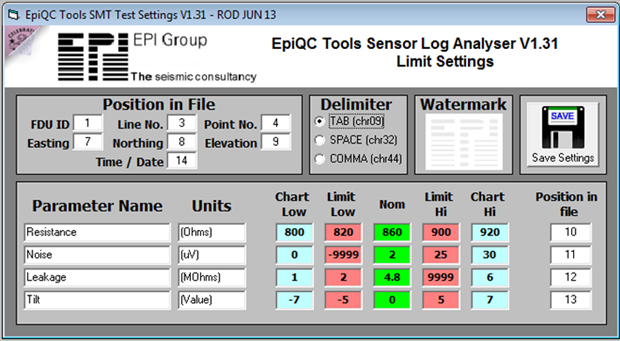
All EpiQC users have access to technical support to help with settings.
EpiQC Software. A quick tour
The following pages give a brief description of some of the features and advantages of using EpiQC software as the standard set of QC Tools on a seismic project.
SMT Analyser
All programs feature
- Directly opens files in any crew format. No reformatting or copy/paste required.
- Read, process and display thousands of tests in just a few seconds.
- Graphical results for quick identification of ‘out of specification’ strings.
- Statistical information can be categorised according to the test carried out.
- Ability to sort data numerically to identify correlation between tests, e.g. Temperature effects.
- Produce text and Excel format data for further analysis, if required.
- Produce a “Word” document report written in plain English for distribution to the client.
- Identify duplicate string ID’s.
- Check data for formatting anomalies and file tampering.
SMT Analyser – Word report excerpt
Report & Charts produced by EpiQC SMT Test Analyser V1.40 Date: 31 July 2013
- A total of 9229 SMT tests were carried out, of which there were 9021 strings with unique ID numbers.
- The 208 string difference will be due to retests and any duplicate string ID’s in the files.
- Out of the 9021 strings with unique ID numbers, 8764 tested good, 257 failed.
- This is a failure rate of 2.8%.
- 91 of the total tests carried out appear to have duplicated ID numbers.
- 8 of the file entries were badly formatted and unreadable.
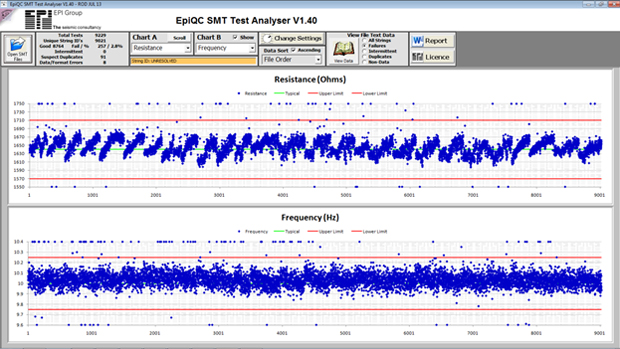
EpiQC SMT Analyser Charts
SMT Analyser – Real world QC
In the following charts the SMT Analyser shows how geophone specifications were improving as elements were replaced during string rotation. At the start of the project the elements were found to be within specification but tending toward the limit for the resonant frequency test. Failure of this test is an indicator of old elements.
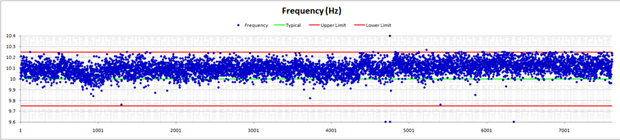
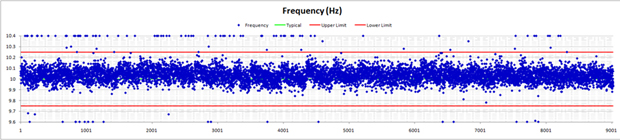
As the project progressed the geophone strings were rotated through the camp. During this process older elements were replace with new ones. The chart below shows a marked improvement in resonant frequency with an overall trend closer to the specified 10Hz.
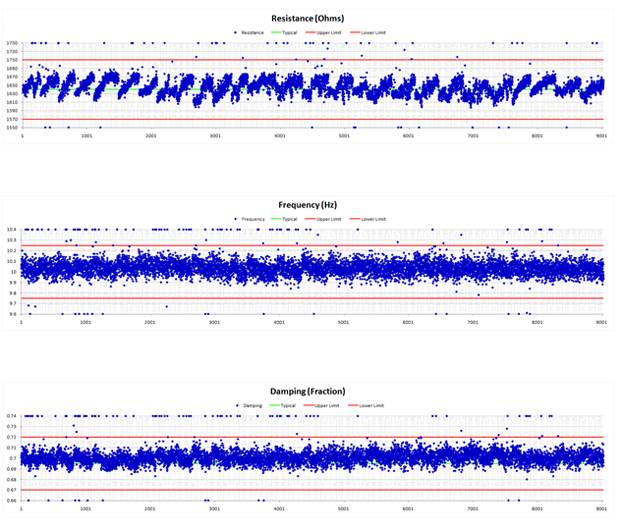
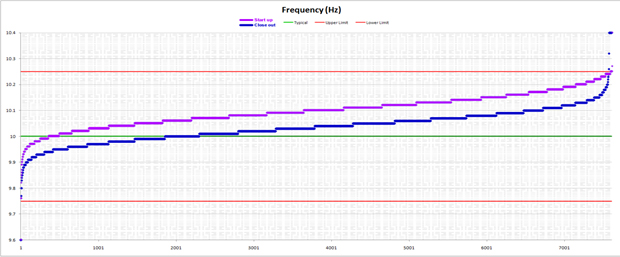
The chart below shows the two sets of tests sorted by resonant frequency and overlaid on a single chart. The chart clearly shows an improvement in resonant frequency after elements were replaced (blue line).
FDU Analyser / Sensor Analyser
These two programs read the Sercel instrument test logs directly and provide a fast but detailed report in both text and graphical form. These logs are presented to the client as daily instrument tests.
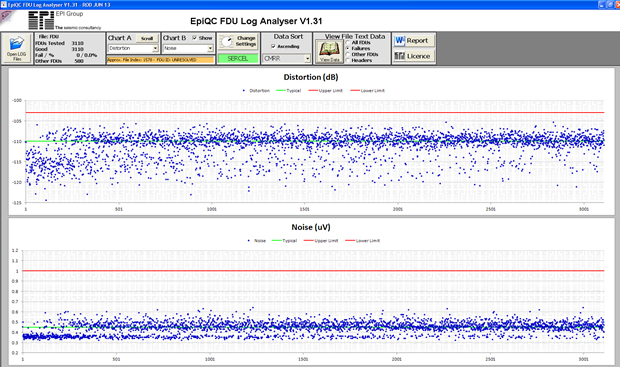
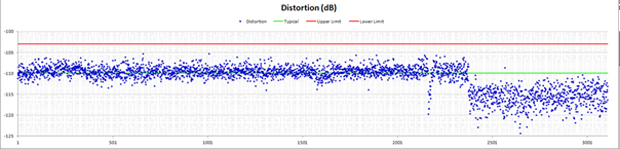
The chart below shows the FDU distortion test data sorted by FDU ID number. It show the crew were using a mix of older (low ID number) and new version (high ID number) FDU’s. The newer version FDU’s had an overall lower distortion level.
Sensor Analyser
The second of the two daily instrument test analysers. The sensor analyser reads and analyses the geophone test data such as noise, tilt, resistance etc.
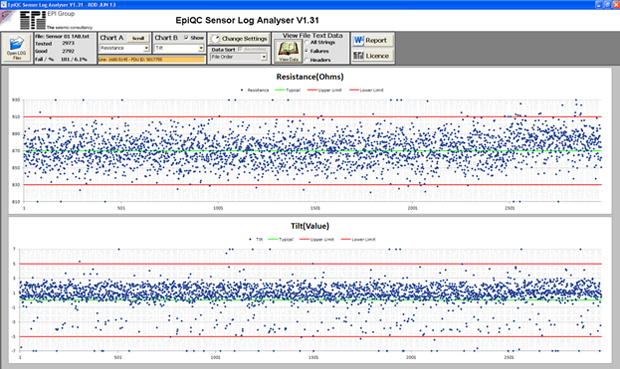
This program has the ability to sort the data into receiver line and point number, as shown in the chart below. This ability provides a good indicator of whether line problems are related to location. Geophone problems apparent in certain locations could indicate difficult terrain or a poorly performing line crew. Note how in the chart below there are some lines which show a noticeably higher overall tilt value. Tilted geophones are a sign of poor planting and the EpiQC Sensor program has identified the lines with poor planting and hence the line crews which worked in this area.
Survey QC (2D & 3D)
This program essentially takes in two coordinate files (x,y,z) and compares them against each other and against a set of preset specifications set at the start of the project. Unusual x,y,z file formats can be specified in the settings. Standard survey sps files with correct headers are read in automatically.
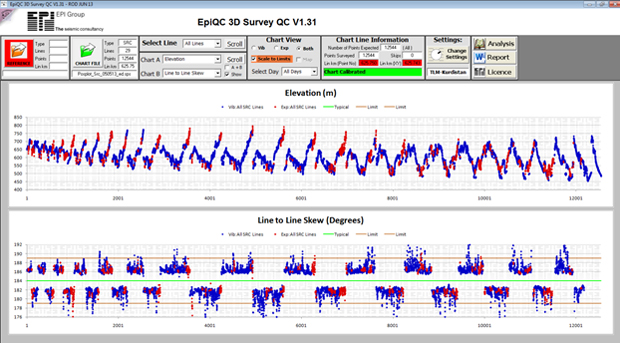
The reference and chart files can be any x,y,z file but as an example the chart below shows a source line preplot loaded into the reference and the source line postplot into the chart. Red points are dynamite, blue points are Vibroseis.
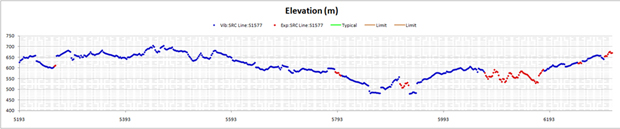
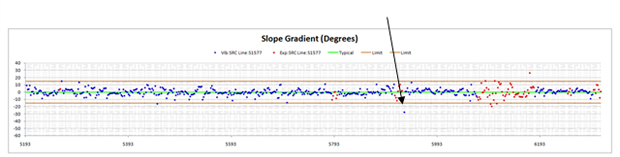
The chart below shows how a single vibrator point outside of the 15° maximum slope permitted by the contract is easily spotted amongst the hundreds of other points…
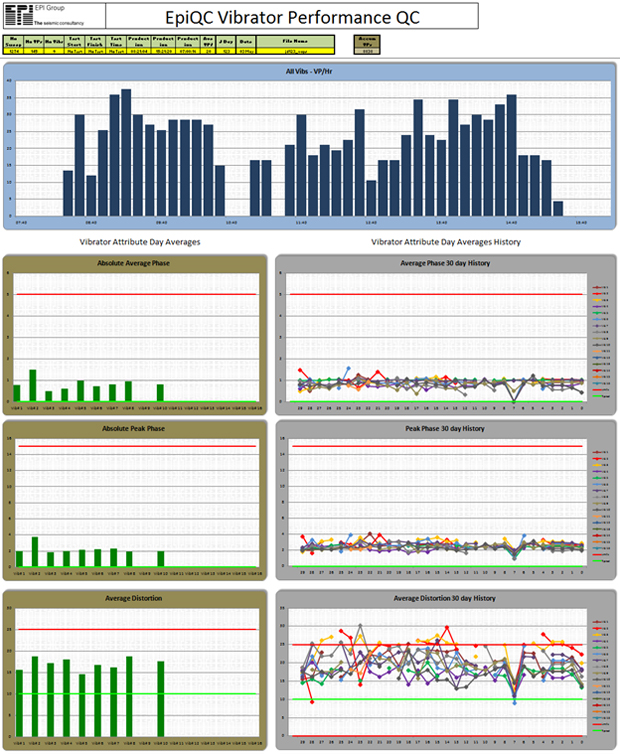
Vibrator Performance QC
This program reads the vibrator attributes (VAPs) file directly and displays overall averages for the day thus giving a quick indication of each vibrator’s performance. A 30 day history is maintained of each vibrator and although a vibrator may show itself to be within specification, if it is found to be consistently under-performing it can be removed from production and the cause investigated.
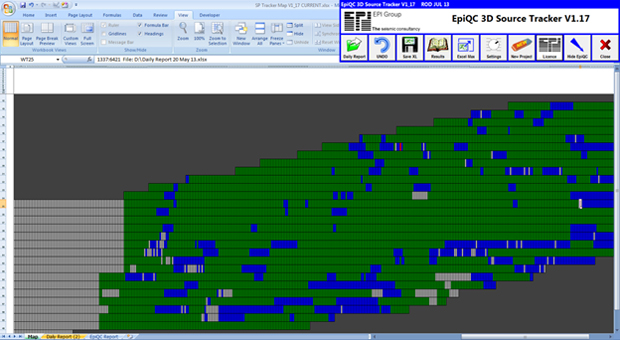
Source Tracker
This program reads the source point ranges directly from the crew daily report. The program checks the totals and plots each SP on a spreadsheet “Cell Map”. The map will clearly show any errors in the crew report such as missing SP’s or SP’s which are reported twice.
The “Cell Map” below shows part of a 3D project. Green cells are Vibrator points, blue cells are dynamite points and red cells show points that have been reported twice (hence will be charged twice to the client).
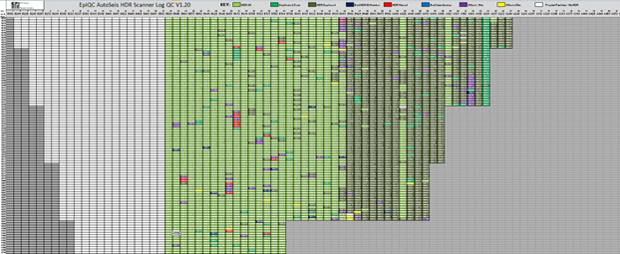
“AutoSeis HDR” Scanner Log
This program also uses a “Cell Map” to show AutoSeis nodal units (HDR’s) laid out and scanned. The different cell colours indicate issues such as duplicates. Scanner GPS data also confirms that the HDR’s are laid out at the correct location. This information helps ensure the layout is proceeding correctly.
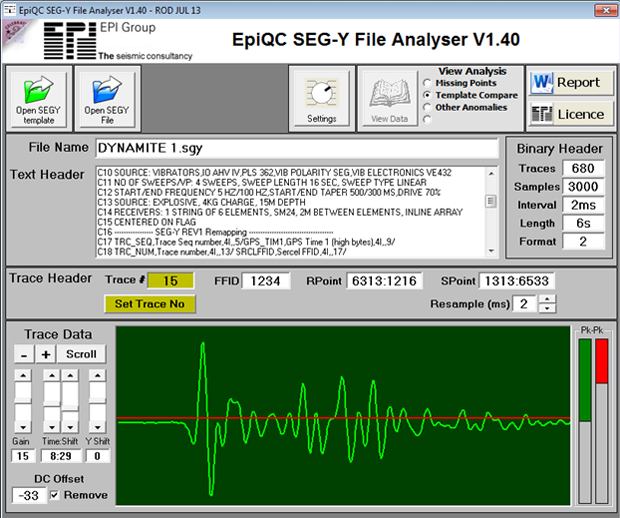
SEGY file analyser
This program reads SEGY files directly and can compare header information to a preset template. This ensures all future SEGY files are compiled correctly. SEGY data is also read and can be checked for various properties such as usable dynamic range or offsets. The picture below shows the program displaying a single trace for a dynamite shot.
Continual Development
Programs are updated under the guidance of feedback from users and clients. Users and various seismic projects also influence the development of new programs. There are many more programs and utilities under development and we typically add one new program per month to the overall EpiQC Software Suite.
For more information on EpiQC please contact the Land Team.